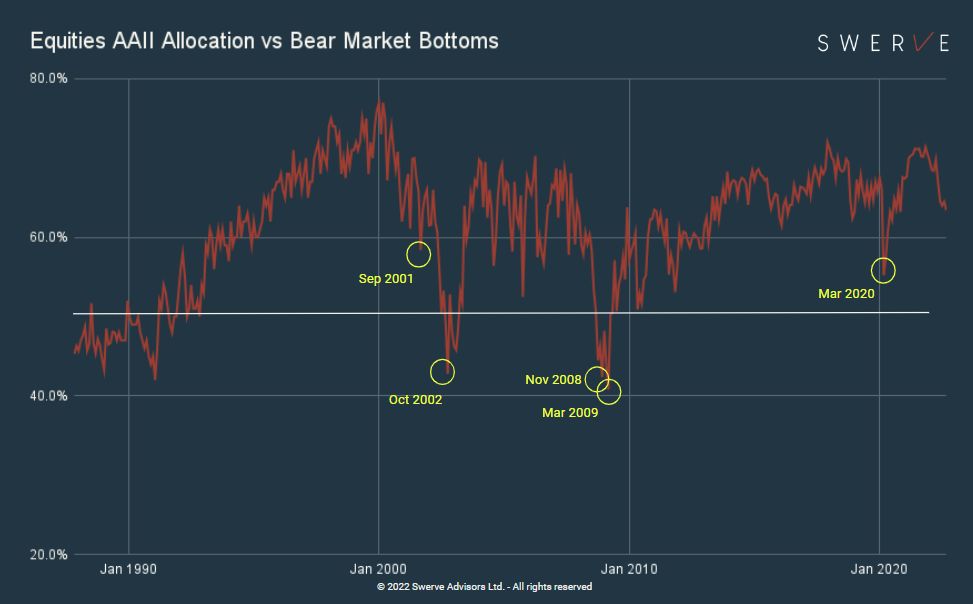
According to this indicator, US equities have yet to bottom
Major market bottoms are typically associated with the capitulation of retail investors. Looking at AAII data for the US market, the pattern is very clear; it is only when retail investors’ allocation to equities collapses relative to the previous levels that prices finally start to find a bottom (see chart).
Over the last 15 years the “#tina ” narrative (“There Is No Alternative” to #equities ) pushed the average allocation to 71% of total assets, a level only exceeded before the dot com bust. Ever declining interest rates made cash and bonds less attractive and pushed equity valuations to record levels. The situation is now in reverse and we have shifted from “TINA” to “TIA”. #inflation has forced policymakers to raise rates and equities are starting to look less attractive relatively to other asset classes.
While the S&P 500 is already down 24% YTD, retail allocation is still at 63% and above its 61% long term average. According to this indicator we are nowhere near a secular bottom for equities. Assuming, for example, a bottom is reached with a retail allocation in the 45% range, as retail investors control approx 50% of the $60+ trillion market, prices would need to shed another 15% from the current levels.
As investors start to wake up to the reality of a new #macro environment, a massive repositioning of #assetallocation is upon us. Higher inflation, constrained real economic growth and geopolitical instability bring about the migration from “fiat” to “real”, from “intangible” to “tangible” and from “deploy” to “store” value. Those with the farsight to swerve earlier may be able to minimize the loss of wealth that has already become the hallmark of this decade.
Disclosure: Hold all assets mentioned. Not investment advice. Do your own research. Twitter: @pietroventani